 |
|
 |
|
Background |
|
Our research endeavours have led to the development of a machine-learning-driven algorithm termed "expHRD," a novel approach that accurately predicts the scarHRD score through RNAseq analysis of specified samples. Our methodology was informed by a training dataset comprising 8,041 samples culled from the TCGA-pan cancer cohort, wherein 4,436 genes were meticulously selected based on their differential expression patterns in HRD-high and -low tumours. Subsequently, the optimal prediction model was constructed utilising the elastic net algorithm, which underwent validation in an independent test sample cohort comprising 2,027 samples. As a pivotal step, we embarked on a bootstrap training process that refined the gene feature pool (resulting in 365 genes) to facilitate the single-sample geneset enrichment analysis-based computation of expHRD. Impressively, this meticulous process culminated in a robust Pearson correlation coefficient of 0.768 (P = 1.829e-12) between expHRD and scarHRD within the test samples sourced from the TCGA ovarian cancer cohort. A key outcome was the impressive area under the ROC curve (AUC) of 0.872 (P = 3.451e-7), vividly reflecting the capability of expHRD to distinguish HRD-high samples (defined by scarHRD > 42). Remarkably, the expHRD score echoed the predictive prowess of scarHRD by significantly stratifying the overall survival of ovarian cancer patients within the test cohort.
Furthermore, our platform sufficiently predicts the HRD in pan-cancer data, thus the web service will be applicable in multiple cancer types including ovarian cancers.
The expHRD scoring system was developed using following process: A total of 10,068 samples of 34 cancer types, including triplet negative breast cancer (TNBC) and ovarian cancers, were trained to predict the scarHRD score, selecting HRD-related gene sets using DEG analysis. Approximately 4,500 genes were selected and trained to predict the scarHRD score using elastic net, resulting in around 2,500 genes being filtered with high correlation (PCC > 0.8) with the scarHRD score. A bootstrap step was conducted to achieve the most robust gene set (n = 356), applying the single-sample gene set enrichment analysis (ssGSEA)-based expHRD (Figure 1).
Our platform's versatility in forecasting HRD across a gamut of cancer types is not to be understated, as underscored by its successful implementation within pan-cancer datasets. The innovative web service designed for ease of use is poised to extend the realms of HRD prediction across diverse malignancies, with ovarian cancer standing as an emblematic example. | |
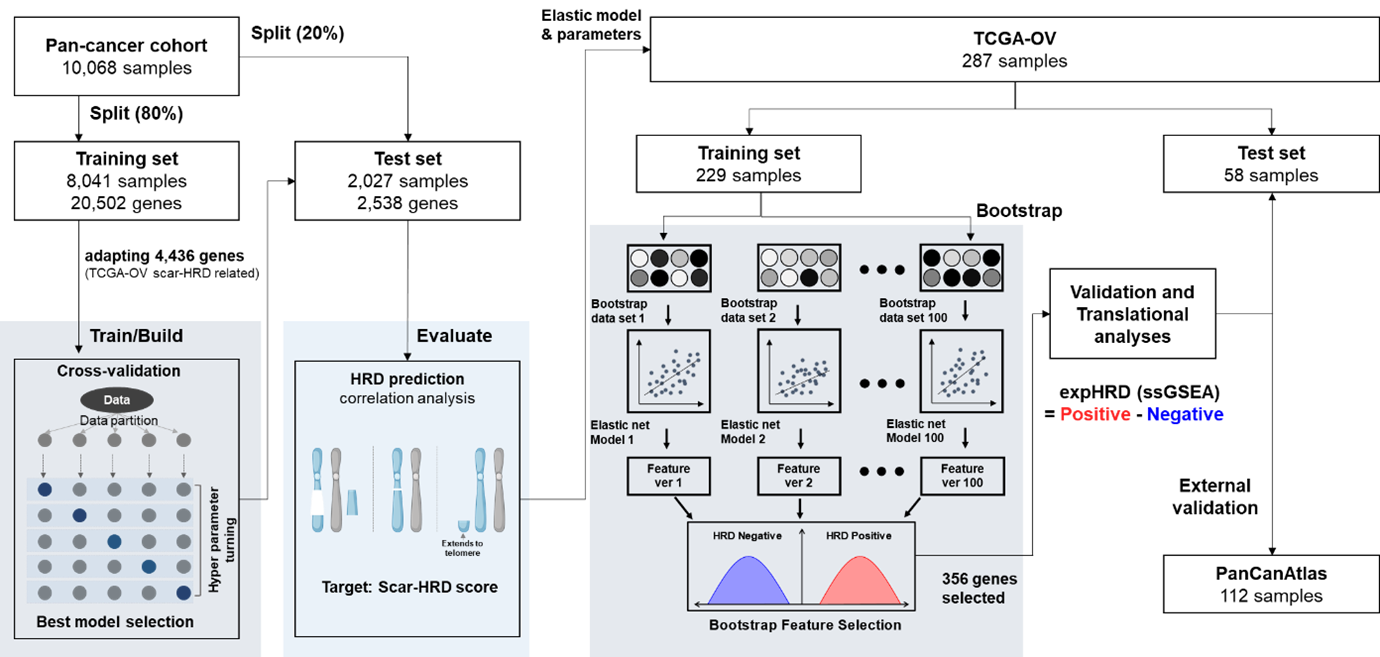 Figure 1. Schematic diagram of HRD prediction model establishment and validation | |
|
The intricate process of expHRD development is delineated below: First step: DEG analysis We first filtered out whole transcriptome genes to determine whether they correlated to HRD scores. The first filtration mainly increases the machine-learning prediction rate (R2 or RMSE). We determined TCGA-OV (ovarian cancer) samples, representing the HRD score among pan-cancer cohorts. In this process, the number of genes was filtered from 20,502 to 4,436. Second step: regression training steps (Elastic Net) The Pearson’s correlation between scarHRD score and predicted HRD score after the elastic net training was 0.8584 in the TCGA-pan cancer test set (sample n = 2,207, Figure 2A). The correlation profile of TCGA-pan cancer test sets showed robust correlations (PCC > 0.8) in various cancer types, including ovarian cancers and TNBC, with considerable significance (p < 0.05, Figure 2B). | |
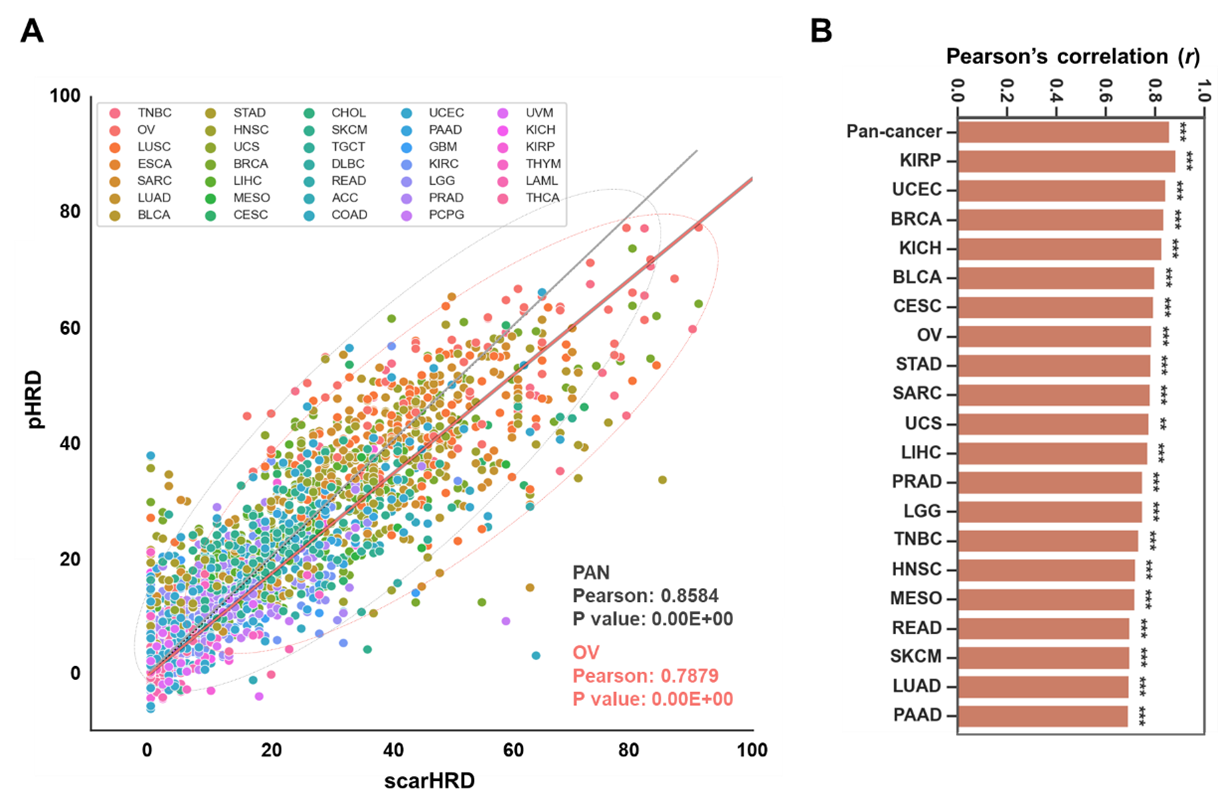 Figure 2. Machine-learning-based prediction of HRD in the TCGA-pan cancer cohort | |
|
Third step: bootstrapping to validate the robustness of HRD-related gene sets An essential phase entailed randomization of the training set, subjecting 2,538 genes to scrutiny to ascertain their fidelity in representing HRD-related genes. The iterative process was informed by the employment of bootstrap algorithms and entailed 100 cycles of random sampling and re-training. This rigorous approach yielded a select gene set, categorised into HRD-positive and HRD negative. The number of genes with positive and negative correlations with scarHRD was 173 and 183 genes (total of 356 genes) selected from 1061 and 942 genes, respectively (Figure 3A) via the bootstrap process. After elastic net training, the sample number was reduced from 4,436 to 2,538, accompanied by an elevation in Pearson correlation coefficient values from 0.533 to 0.752. Interestingly, additional elastic net iterations failed to yield improved correlation (gene n = 2,337, PCC = 0.769). Conversely, the bootstrap process markedly decreased the feature number to 356 with a PCC of 0.767 (Figure 3A). The final gene set (n = 356) was used for the expHRD calculation based on the ssGSEA approach. | |
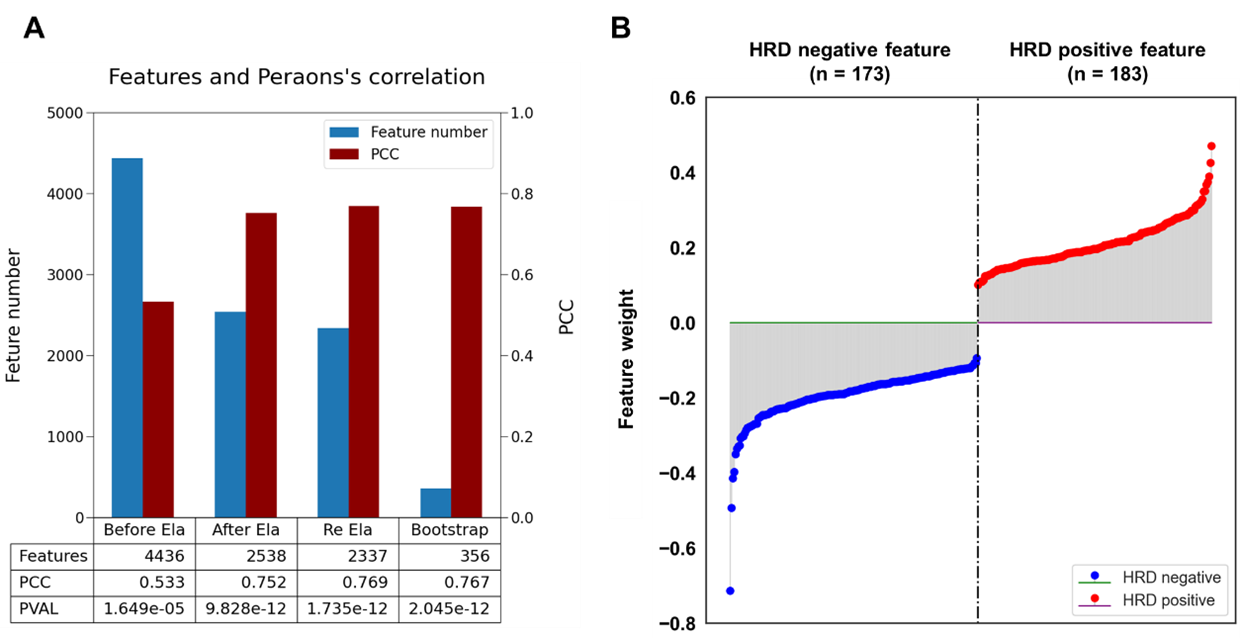 Figure 3. Bootstrap to enrich the HRD-related gene set for expHRD calculation | |
|
We analysed ssGSEA with the TCGA-OV test set (n = 58) to estimate the expHRD score. The selected gene sets (n = 356) represent the status of HRD in samples, and we defined the ssGSEA score as expHRD. Correlation analysis was also investigated to precisely predict scar HRD by adapting the expHRD score and calculating the linear regression function. | |
|
Final step: web service development. We developed a user-friendly web service allowing researchers to obtain a predicted HRD score equivalent to scarHRD by uploading their own transcriptome data from a single tumour. The website is free and has no login requirements. The main features of the web service are as follows: - One-step analysis: The calculated HRD scores (expHRD) are displayed by clicking the “Upload” button to input a DESeq2-based gene-expression profile of single or multiple samples and the “Run” button. - Provision of predicted scarHRD score: Users will be provided with predicted scarHRD values derived from expHRD, conferring clinical applicability. - Graphical visualisation: expHRD and predicted scarHRD are visualised using pre-built libraries established from TCGA data, representing the relative values of their samples. |